Set up Statistics
Learn how to enable statistics and view charts in Simulation Mode.
Preparation
Section titled “Preparation”- Log in at Rackflow
- Use a model with conveyors, racks, and SRMs. Expand from First Storage or your own model.
Activate Statistics for SRMs
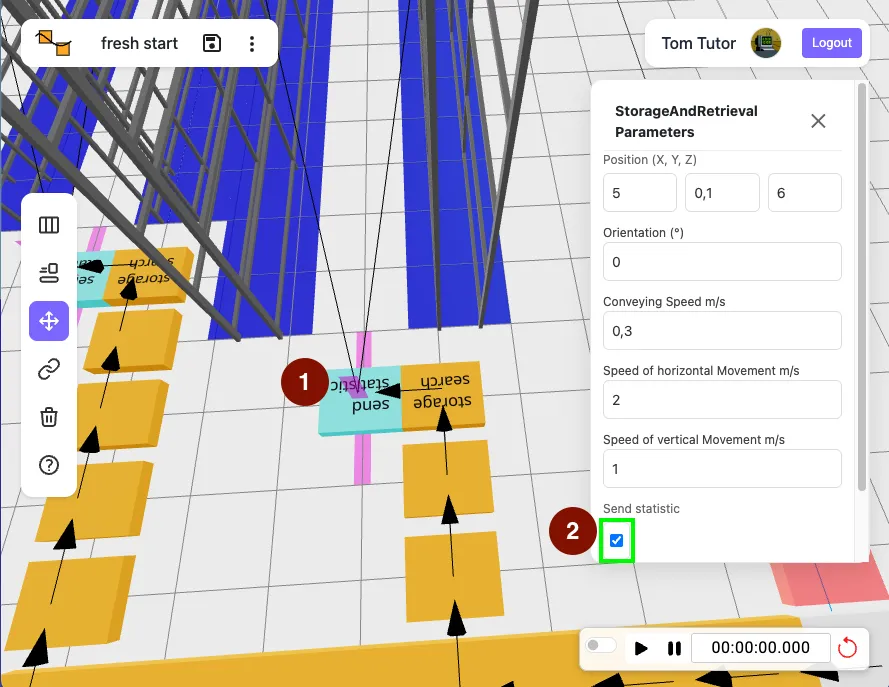
Section titled “Activate Statistics for SRMs”- Select an SRM.
- Enable “Send statistic”.
- Repeat for each SRM.
Activate Statistics for Convevors
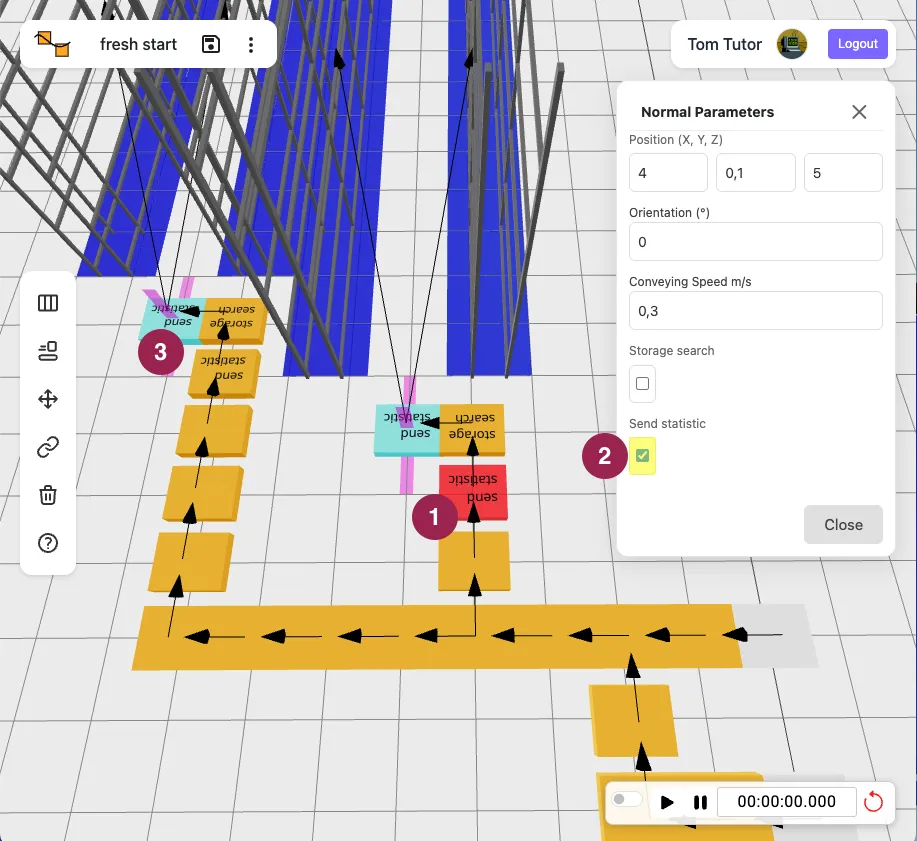
Section titled “Activate Statistics for Convevors”- Select a conveyor.
- Enable “Send statistic”.
- Repeat for each key conveyors.
Run Simulation and View Charts
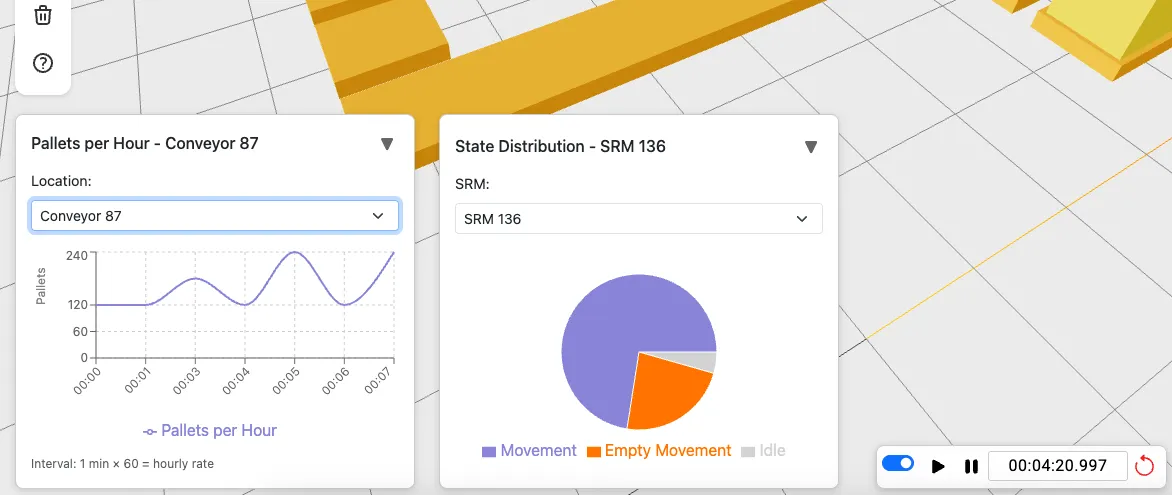
Section titled “Run Simulation and View Charts”Switch to Simulation Mode and run for a few minutes. Confirm statistics appear for configured devices.
Charts appear minimized at the bottom; click the triangle to expand. The left graph shows pallets per hour (calculated per minute). The right pie chart displays SRM utilization; use the dropdown to switch devices or locations.
Congratulations 🎉
Section titled “Congratulations 🎉”Your warehouse simulation now tracks statistics.